How Does Austin-Area Inventory Look Right Now?
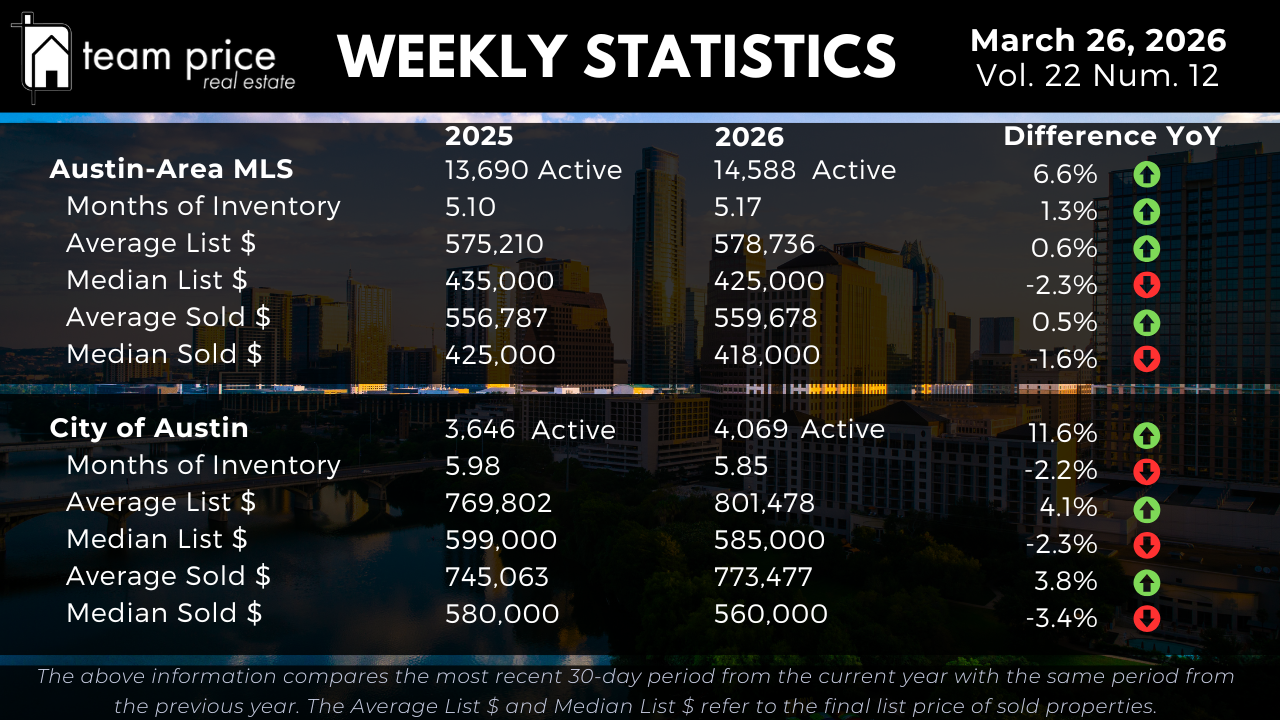
Active inventory across the Greater Austin MLS stands at 14,588 homes, a 6.6% increase compared to the same point last year when there were 13,690 listings on the market. Despite that growth, months of inventory has barely moved — currently at 5.17 months compared to 5.10 months a year ago, a 1.3% increase. That near-flat months of supply figure tells you something important: demand is absorbing the new inventory about as fast as it's arriving.
In the City of Austin, active listings have grown to 4,069 compared to 3,646 a year ago, an 11.6% jump. But the City of Austin's months of inventory actually ticked down slightly, from 5.98 to 5.85, a 2.2% decrease. More homes are available inside city limits, yet the pace of absorption is keeping up — and then some. That is not a market losing momentum.
What Are Homes Listed and Selling for in the Austin-Area MLS?
The average list price for active homes in the Austin-Area MLS is $578,736, up 0.6% year over year from $575,210. The median list price is $425,000, down 2.3% from $435,000 a year ago. That divergence — the average rising while the median falls — suggests sellers at the upper end of the market are holding firm on price, while the broad middle of the market continues to reset.
On the sold side, the average sold price this month is $559,678, up 0.5% from $556,787 a year ago. The median sold price is $418,000, down 1.6% from $425,000 in March 2025. These are modest moves in either direction. The Austin housing market is not crashing, and it is not recovering dramatically. It is finding a level — and the negotiation data suggests that level may be close.
The sold price to list price ratio for the Austin-Area MLS is 97.41%, meaning the typical home is selling for about 2.6% below its asking price. That's thin margin for buyers but meaningful room when applied to a $500,000 home.
What Are Home Prices Doing Inside the City of Austin?
The City of Austin is telling a different price story than the broader MLS. Average active list prices in the city are $801,478, up 4.1% year over year from $769,802. Median active list prices are $585,000, down 2.3% from $599,000 — again, the upper end holding while the middle softens.
On the sold side, the City of Austin average sold price is $773,477, up 3.8% from $745,063 a year ago. The median sold price is $560,000, down 3.4% from $580,000. The city's average sold price rising 3.8% while the median falls 3.4% reflects a market where high-end transactions are pulling the average up, but the typical home — the one most buyers are actually competing for — is still priced below where it was a year ago. For buyers targeting the City of Austin in the mid-price range, that's real purchasing power.
Who Has the Leverage at the Negotiating Table Right Now?
Buyers still hold measurable leverage in Central Texas real estate, but it is shrinking. This month, 65.58% of homes sold under list price, down from 67.95% last month. The share selling at list price was 20.43%, down slightly from 21.19% in February. The share selling over list price was 13.98%, up from 10.86% last month and just ahead of the 13.11% recorded in March 2025.
That over-list trend is the one to watch. It is not yet the dominant pattern — the majority of homes are still closing below asking — but the directional movement is clear. Month over month, fewer homes are conceding on price. That shift doesn't happen all at once. It happens the way it's happening now: gradually, then noticeably.
For buyers, this is not a reason to panic. It is a reason to be prepared. A pre-approval in hand, a clear sense of value in your target neighborhoods, and a willingness to act when the right home comes available are the practical tools that matter most in a market moving in this direction.
How Are Individual Cities and ZIP Codes Performing Across Central Texas?
The price data at the city and ZIP code level adds important texture to the MLS-wide numbers. Looking at the 30 cities tracked across Central Texas, 17 — or 57% — posted month-over-month price increases this week, while 13 cities, or 43%, saw prices decline. Year over year, 12 cities (40%) are above where they were in March 2025, and 18 cities (60%) are still below. Zero cities are above their peak price from the last 12 months, meaning every market in this report is still in recovery territory from a local high.
The ZIP code data follows a similar pattern. Of the 75 ZIP codes tracked, 41 (55%) posted month-over-month increases and 34 (45%) posted decreases. Year over year, 26 ZIP codes (35%) are higher than they were at this time last year, while 48 (64%) remain below. Only 1 ZIP code is currently above its 12-month peak. That near-universal distance from peak pricing is the data point that frames opportunity for buyers — and caution for sellers who may be pricing against where the market was rather than where it is.
Within the City of Austin's ZIP codes, the spread is wide. Established central neighborhoods and the western corridor continue to show relative strength, while outer ring areas and some eastern corridors are still working through excess supply. Buyers with flexibility on location have the most room to negotiate. Sellers in the tighter, lower-inventory pockets have the most leverage.
How Far Are Austin Home Prices From Their Peak?
The peak comparison data is a useful anchor for understanding how much ground has been recovered — and how much hasn't. For the Austin-Area MLS, the average sold price peaked in March 2025 at $845,638 and currently sits at $573,747, a drop of $271,891 or 32.2%. The median sold price peaked in May 2022 at $538,000 and currently stands at $432,500, down $105,500 or 19.6%. Price per square foot tells the same story: the average sold price per square foot peaked at $331 in March 2025 and is now $255, down 23.0%. The median sold price per square foot peaked at $280 in April 2022 and is now $212, down 24.3%.
For active listings in the MLS, the average list price peaked at $708,929 in March 2023 and currently sits at $578,736 — though the peak table tracks this metric at $681,832 — a drop of $27,097 or 3.8% from that peak. The median list price peaked at $539,900 in May 2022 and is currently $464,995, down $74,905 or 13.9%.
The City of Austin peak data tells a more compressed story. The average sold price peaked at $847,583 in May 2022 and is currently $775,062, down $72,521 or 8.6% — a much smaller distance from peak than the broader MLS. The median sold price peaked at $680,000 in May 2022 and is now $555,872, down $124,128 or 18.3%. The City of Austin average list price peaked more recently — September 2025 at $957,905 — and has since come down to $864,031, a drop of $93,874 or 9.8%. Price per square foot in the city peaked at $442 in May 2022 and currently sits at $352, down 20.4% on the average side. The median sold price per square foot peaked at $393 in April 2022 and is now $212, down 27.0%.
What Does the Austin Real Estate Market Look Like Heading Into Spring?
The data this week paints a picture of a market that is no longer falling and not yet fully rising — but shifting in a clear direction. Inventory is up, which gives buyers options. But months of supply is nearly flat, which means those options aren't piling up uncontested. The over-list-price share is climbing. More than half of tracked cities and ZIP codes posted month-over-month price gains. The Activity Index for the Austin-Area MLS is at 24.9%, up from 24.5% a year ago.
March historically sets the tone for the spring selling season in Central Texas real estate, and the early indicators this year are positive. Pending sales are up. Buyer engagement is rising. The gap between where prices are and where they peaked gives buyers a concrete reason to act — and sellers who price accurately today a real chance to capture the momentum that's building.
The window of maximum buyer leverage may not stay open through summer. The data doesn't guarantee that — nothing in real estate does. But it does suggest that the buyers and sellers who engage the market now, with clear eyes on the data, are better positioned than those who wait for certainty that never arrives.